Software development
The analysis of complex astronomical datasets and simulations requires of specific software. In the workgroup of Prof. Dr. Peter Schilke, we have developed the following programmes that are available for the community, either freely available or via collaboration with our group.
STATCONT - A statistical continuum level determination for line-rich sources
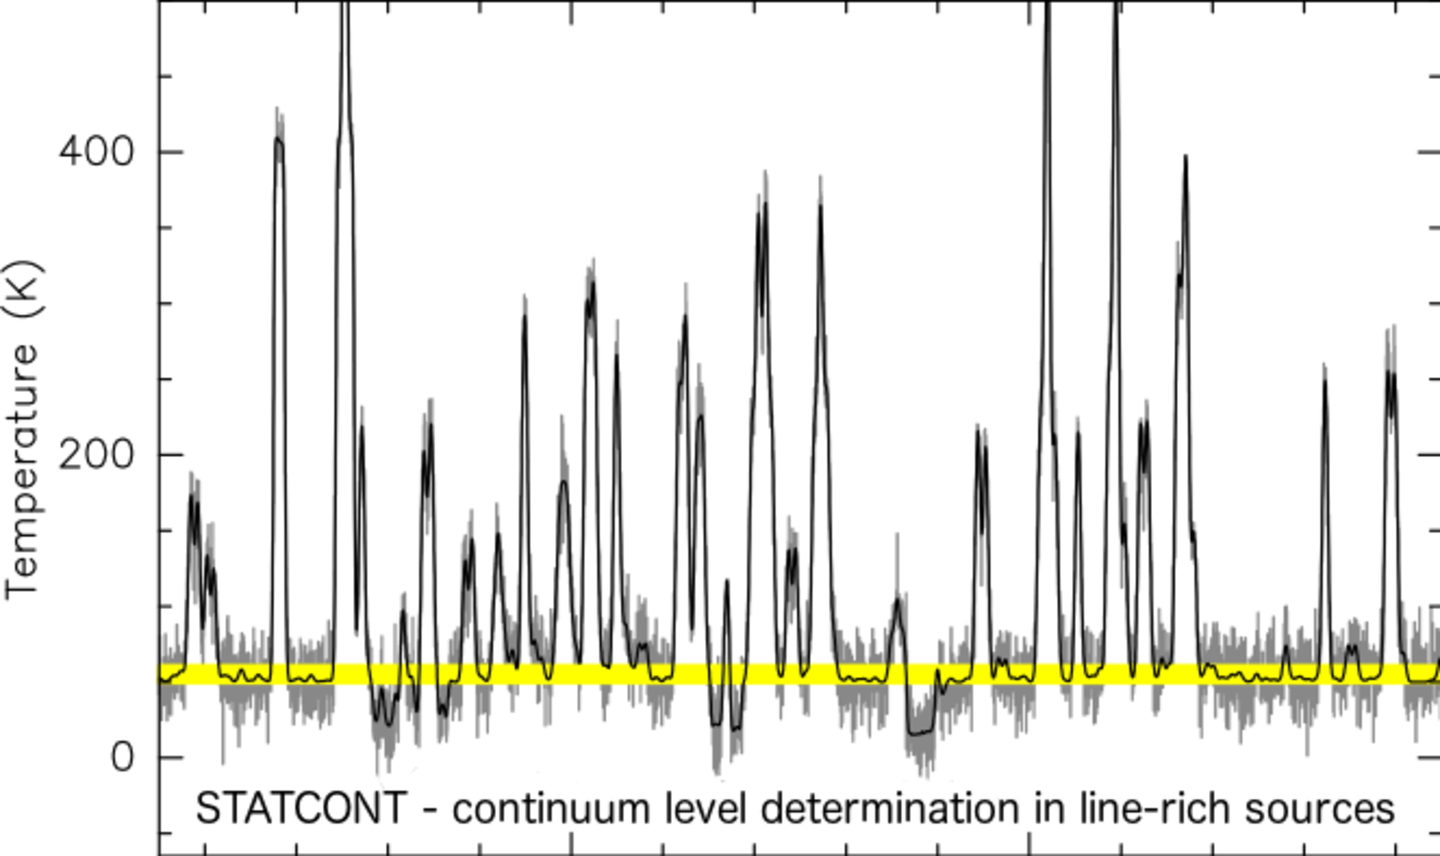
STATCONT is a python-based tool designed to determine the continuum emission level in line-rich spectral data. The tool inspects the intensity distribution of a given spectrum and automatically determines the level by using different statistical approaches. In general, STATCONT has been proved to be accurated at a level < 10%, and < 5% in most cases. The main products are images of the continuum emission level, the error of the determination, and cubes containing only spectral line (i.e. continuum-subtracted cubes). You can find more information here.
MAGIX
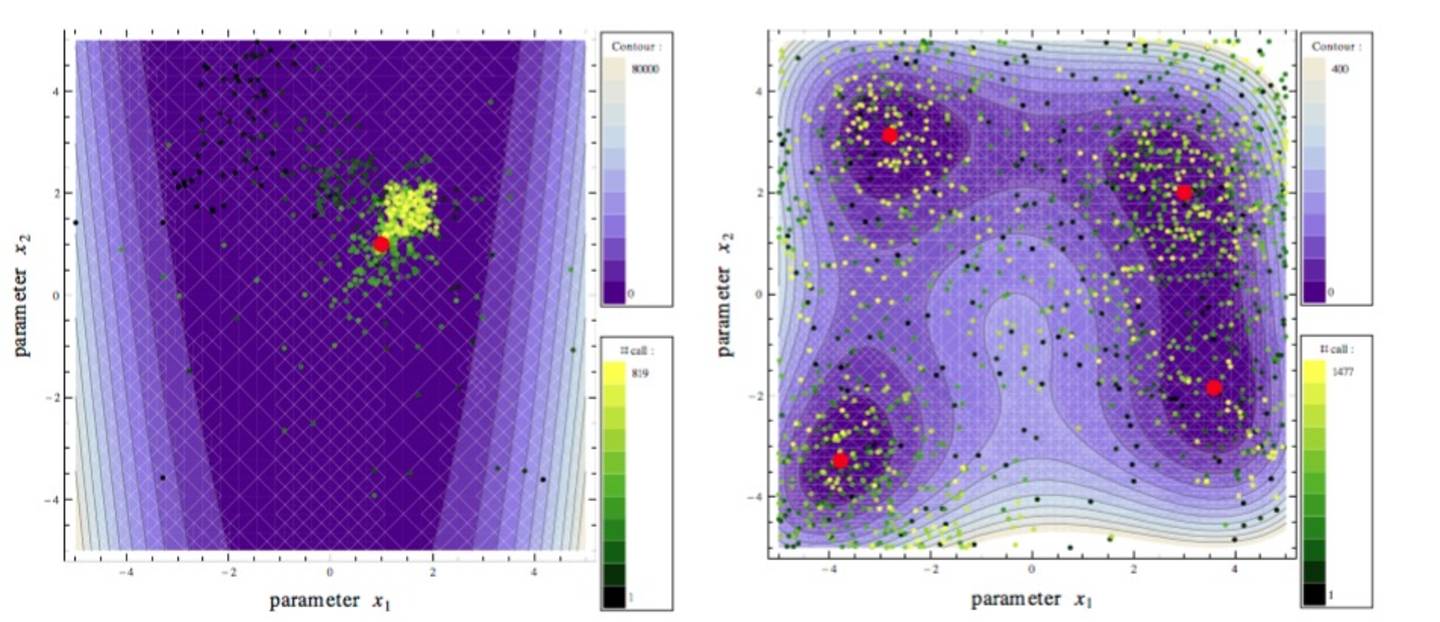
The program MAGIX provides a framework to easily interface existing codes to an iterating engine that allows automatic minimizations to constrain model parameters and provide error estimates. MAGIX was developed under Linux (Ubuntu and SuSE) and works for MACs as well.You can find more information here.
XCLASS - eXtended CASA Line Analysis Software Suite

XCLASS is a toolbox for the Common Astronomy Software Applications package (CASA) aim at fitting spectral line data from astronomical sources observed both with interferometers or single dish telescopes. XCLASS models a synthetic spectrum that is automatically compared to the data with the aim of providing a measurement of physical quantities like the temperature, molecular abundance, and velocity.
The toolbox contains an interface for the model optimizer package MAGIX (Modeling and Analysis Generic Interface for eXternal numerical codes), which helps to find the best description of the data using a certain model, i.e., finding the parameter set that most closely reproduces the data. XCLASS can also automatically identify the molecules producing a given spectrum by using the molecular databases available in the VAMDC (Virtual Atomic and Molecular Data Centre) and the CDMS (Cologne Database for Molecular Spectroscopy). You can find more information here.