Absorption Spectroscopy
Investigators
- Holger Müller
- Sven Thorwirth
- Luis Bonah
- Myrofora Lazaridou
Description
In space, there are places so far away that no human would survive traveling there, at least not with our current forms of traveling. Nonetheless, we have a good understanding of some of these places. How do we obtain information about these places without ever having been there? The answer is, that these places send information towards us via the light emitted from them. Here on earth, we detect this light and extract the information from the light spectrum. The basic principle is, that each atom or molecule has its own distinctive spectrum which identifies it unambiguously. This is why we call these spectra the spectroscopic fingerprints of the molecule.
The problem is, as you might know from your favorite detective show, that a fingerprint is only valuable if it can be compared against some kind of database. For molecular spectroscopy, we record the fingerprints of molecules with absorption spectroscopy in our labs and use them to fill databases like our own Cologne Database for Molecular Spectroscopy (CDMS). This allows astronomers to compare fingerprints found in far-away places with the fingerprints found here on earth and learn more about these places.
Methods
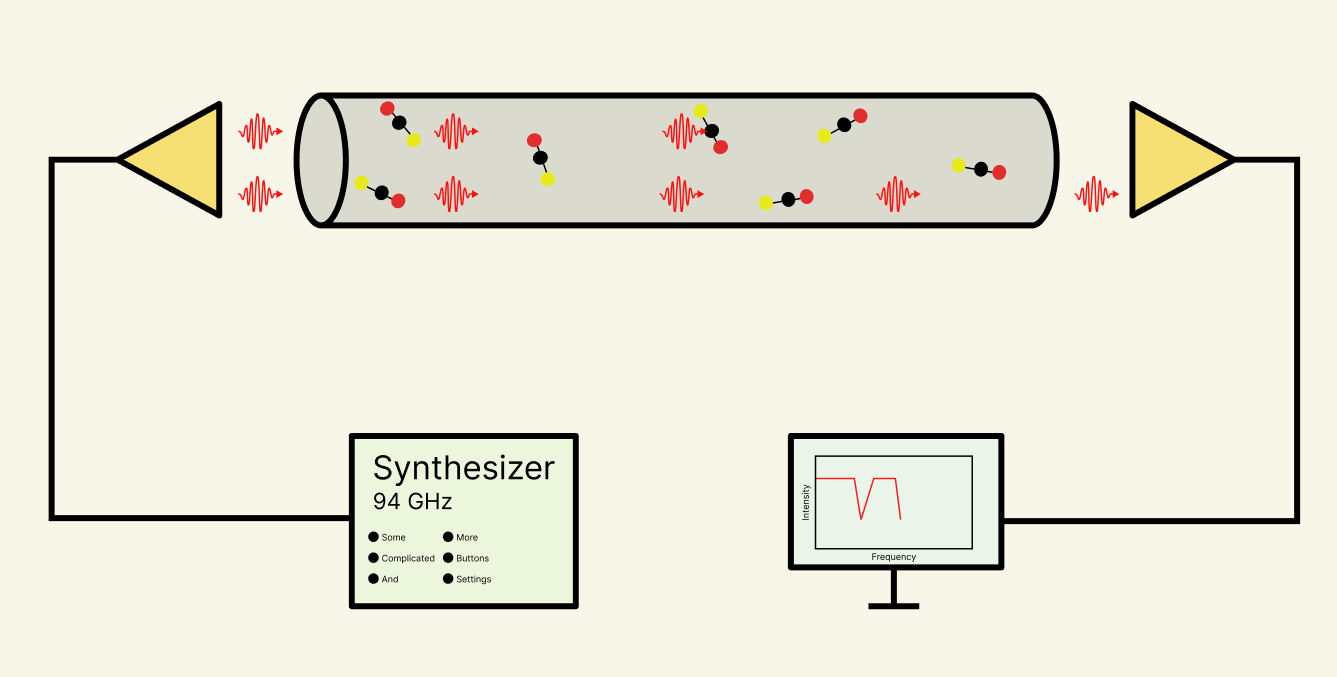
Our simplest absorption spectroscopy setup consists of a frequency source, an absorption cell, and a detector. The frequency source generates the radiation that is sent through the absorption cell. The absorption cell is filled with the molecule of interest which absorbs specific frequencies of the radiation. Behind the cell, the detector measures the transmitted light. By stepping through different frequencies, we can see which frequencies are absorbed by the molecule and record a spectrum. Here in Cologne, we have three absorption experiments that allow us to cover (almost) the entire frequency range from 36 to 1100 GHz. For cases where even this frequency coverage is not enough, we are regularly granted beam time at the french national synchrotron facility SOLEIL to extend our measurements into the higher rovibrational frequency region.
However, for more complicated molecules this simple approach is not sufficient and we have to apply Double Resonance (DR) and Double-Modulation Double-Resonance (DM-DR) techniques or use Loomis-Wood plots.
DR & DM-DR Techniques
The Double Resonance (DR) and Double-Modulation Double-Resonance (DM-DR) techniques use a second frequency source, the so-called pump source. The pump source allows to manipulate the levels of a known transition. By comparing the spectra with and without the pump source we can identify transitions sharing an energy level of the known transition. The DM-DR technique does this comparison in real-time, resulting in a spectrum that only consists of transitions sharing an energy level with the pumped transition. This drastically simplifies assigning quantum numbers to the lines in the spectrum and allows to unambiguously assign transitions in complicated and dense spectra.
Loomis-Wood Plots
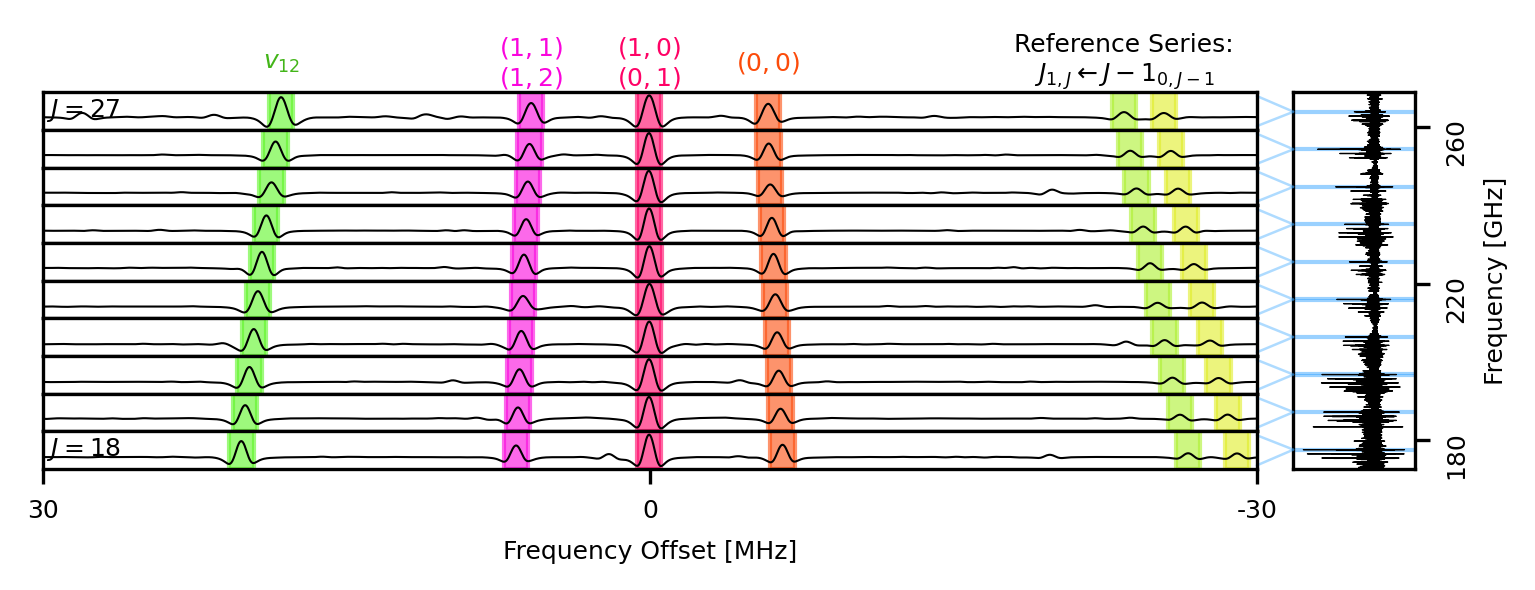
Loomis-Wood Plots (LWPs) are a visual aid for displaying spectra of molecules. They exploit the fact, that transitions of one series are in first approximation equidistantly spaced. By plotting excerpts of the spectrum at these positions on top of each other, the transition appears as an easy-to-follow curve. This supports assignment as adjacent transitions increase efficiency and confidence. We are actively developing our own LWP software called LLWP.
Selected Publications
-
LLWP - A new Loomis-Wood Software at the Example of Acetone-13C1
L. Bonah, O. Zingsheim, H. S. P. Müller, J.-C. Guillemin, F. Lewen, and S. Schlemmer
J. Mol. Spectrosc. 388, 111674 (2022) -
Millimeter-millimeter-wave double-modulation double-resonance spectroscopy
O. Zingsheim, L. Bonah, F. Lewen, S. Thorwirth, H. S. P. Müller, and S. Schlemmer
J. Mol. Spectrosc. 381, 111519 (2021). -
Millimeter- and submillimeter-wave spectroscopy of disulfur dioxide, OSSO
M. Martin-Drumel, J. van Wijngaarden, O. Zingsheim, F. Lewen, M. Harding, S. Schlemmer, and S. Thorwirth
J. Mol. Spectrosc. 307, 33-39 (2015).
Acknowledgments
Funding by the Deutsche Forschungsgemeinschaft through grant SFB 1601, and TH1301/3-2 is gratefully acknowledged.