Theoretical Astrophysics group Cologne - TAC
Our research deals with the numerical modelling of the star formation process by means of high-performance, 3D, magneto-hydrodynamical (MHD) simulations. The simulations cover large spatial scales from ISM physics on kpc scales over molecular clouds on scales of 10 - 100 pc to star forming filaments on (sub-) pc scales and finally to protostellar discs and jets on scales of 10 - 1000 AU.
In our research group we use several tools like the (M)HD codes FLASH, GADGET, GANDALF, the astrochemical code KROME, 3D-PDR or radiative transport codes like RADMC-3D and POLARIS.
Prof. Dr. Stefanie Walch-Gassner is the head of the SILCC project (SImulating the life Cyle of molecular Clouds), a collaboration of several European astrophysical institutes, which has set the aim to model the formation, evolution, and dispersal of molecular clouds in 3D, MHD simulations with particular focus on a detailed astro-chemical modelling and the inclusion of various feedback processes.
Contact information:
- Phone: (+49|0) 221 / 470 - 3497
- Fax: (+49|0) 221 / 470 - 5162
- Email: walch [at] ph1.uni-koeln.de
Consultation hours
upon agreement in Room 1.14, Building 312
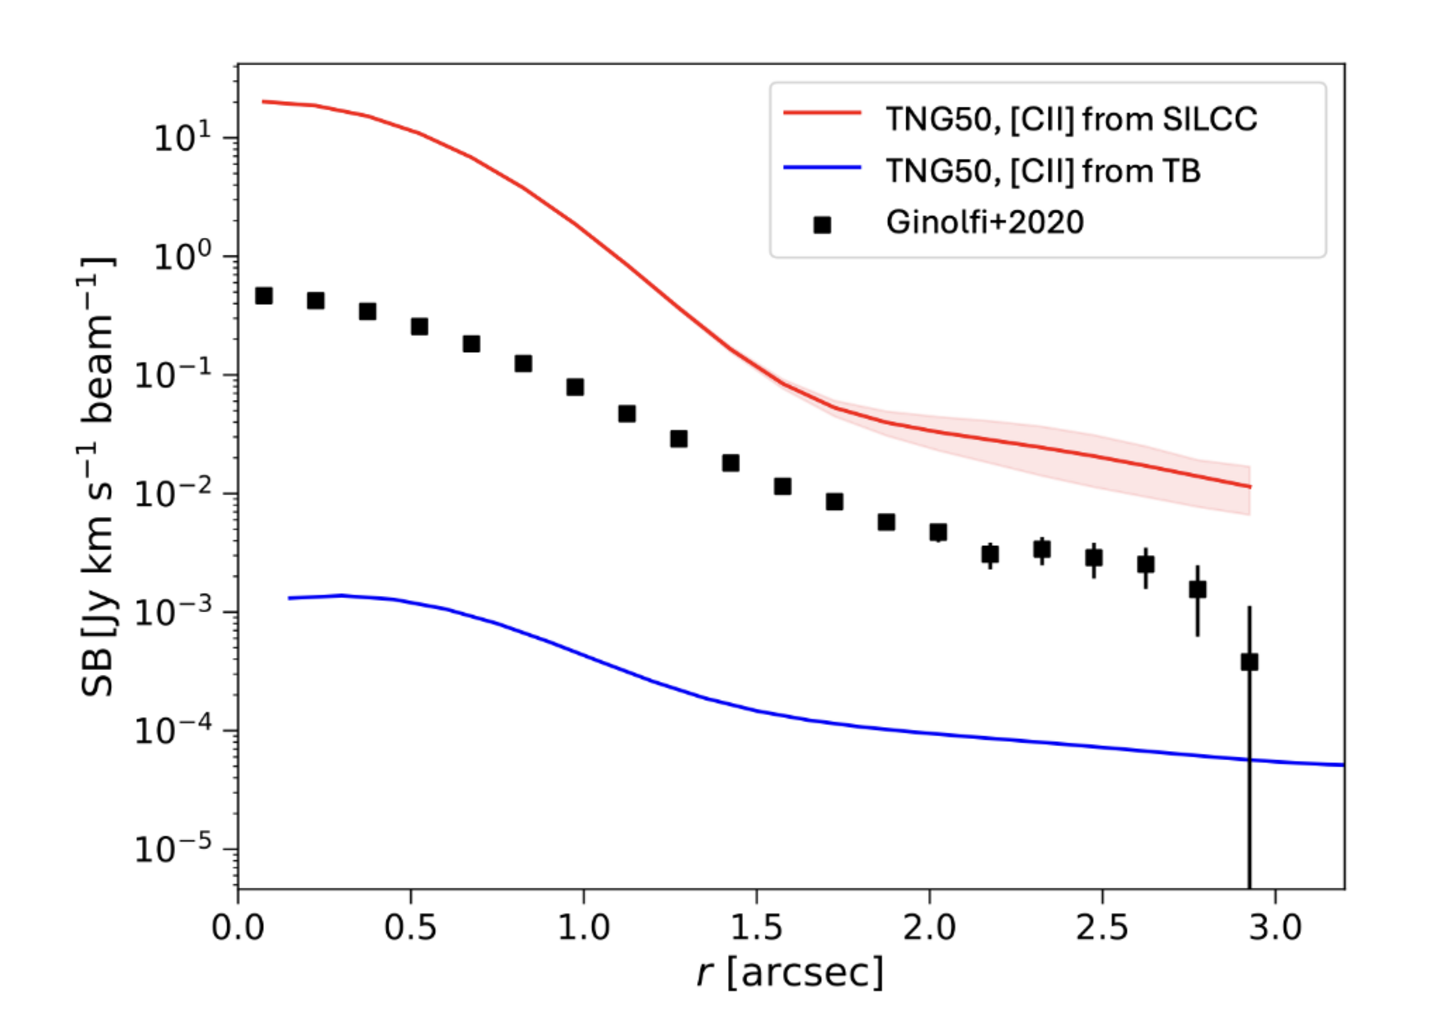
Simulating [CII] emission in high-redshift galaxies and their halos