Understanding synthetic polarization spectra
Thorsten Balduin
In our quest of understanding dust grain alignment, their polarization spectra and the impact of certain dust grain properties better, a lot of exciting results have been achieved.
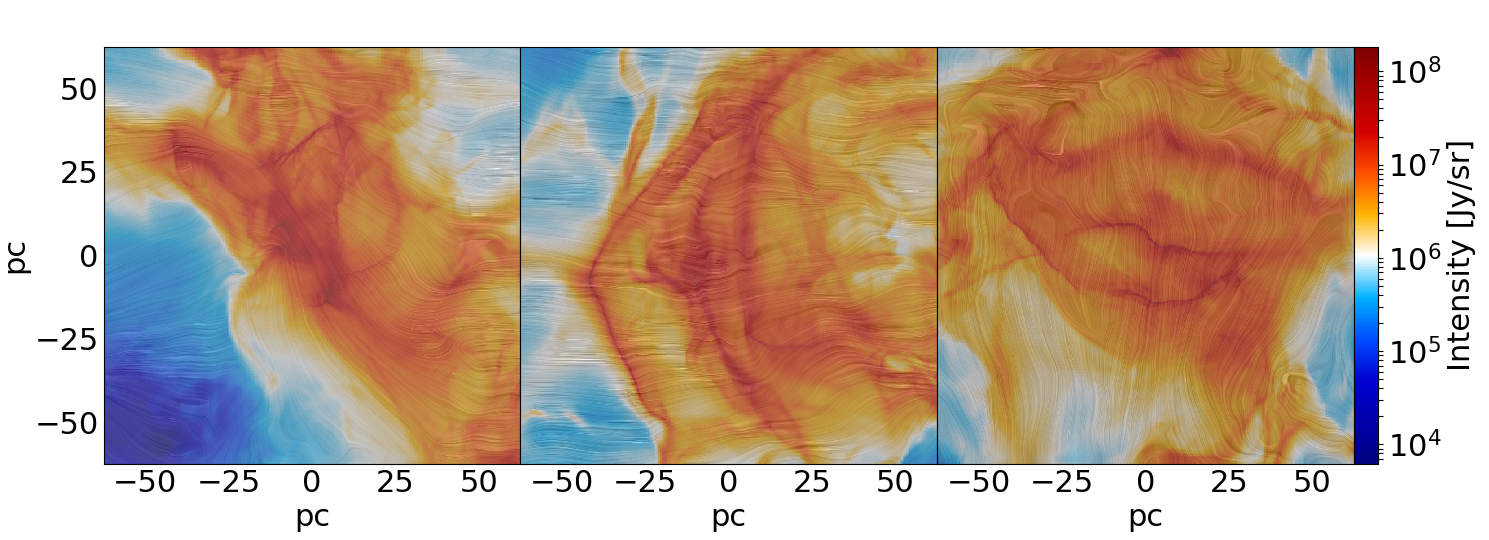
As a quick reminder, dust grains are imagined to be oblate spheroids and can align along their longer axis, perpendicular to magnetic fields. This effect allows us to investigate the magnetic field strength and morphology and the polarization of stellar light by dust grains in our simulations. The former can be illustrated with a line integral convolution plot. This technique takes a vector field and instead of plotting single vectors on a grid, it interpolates between the vectors and creates a flowing image.
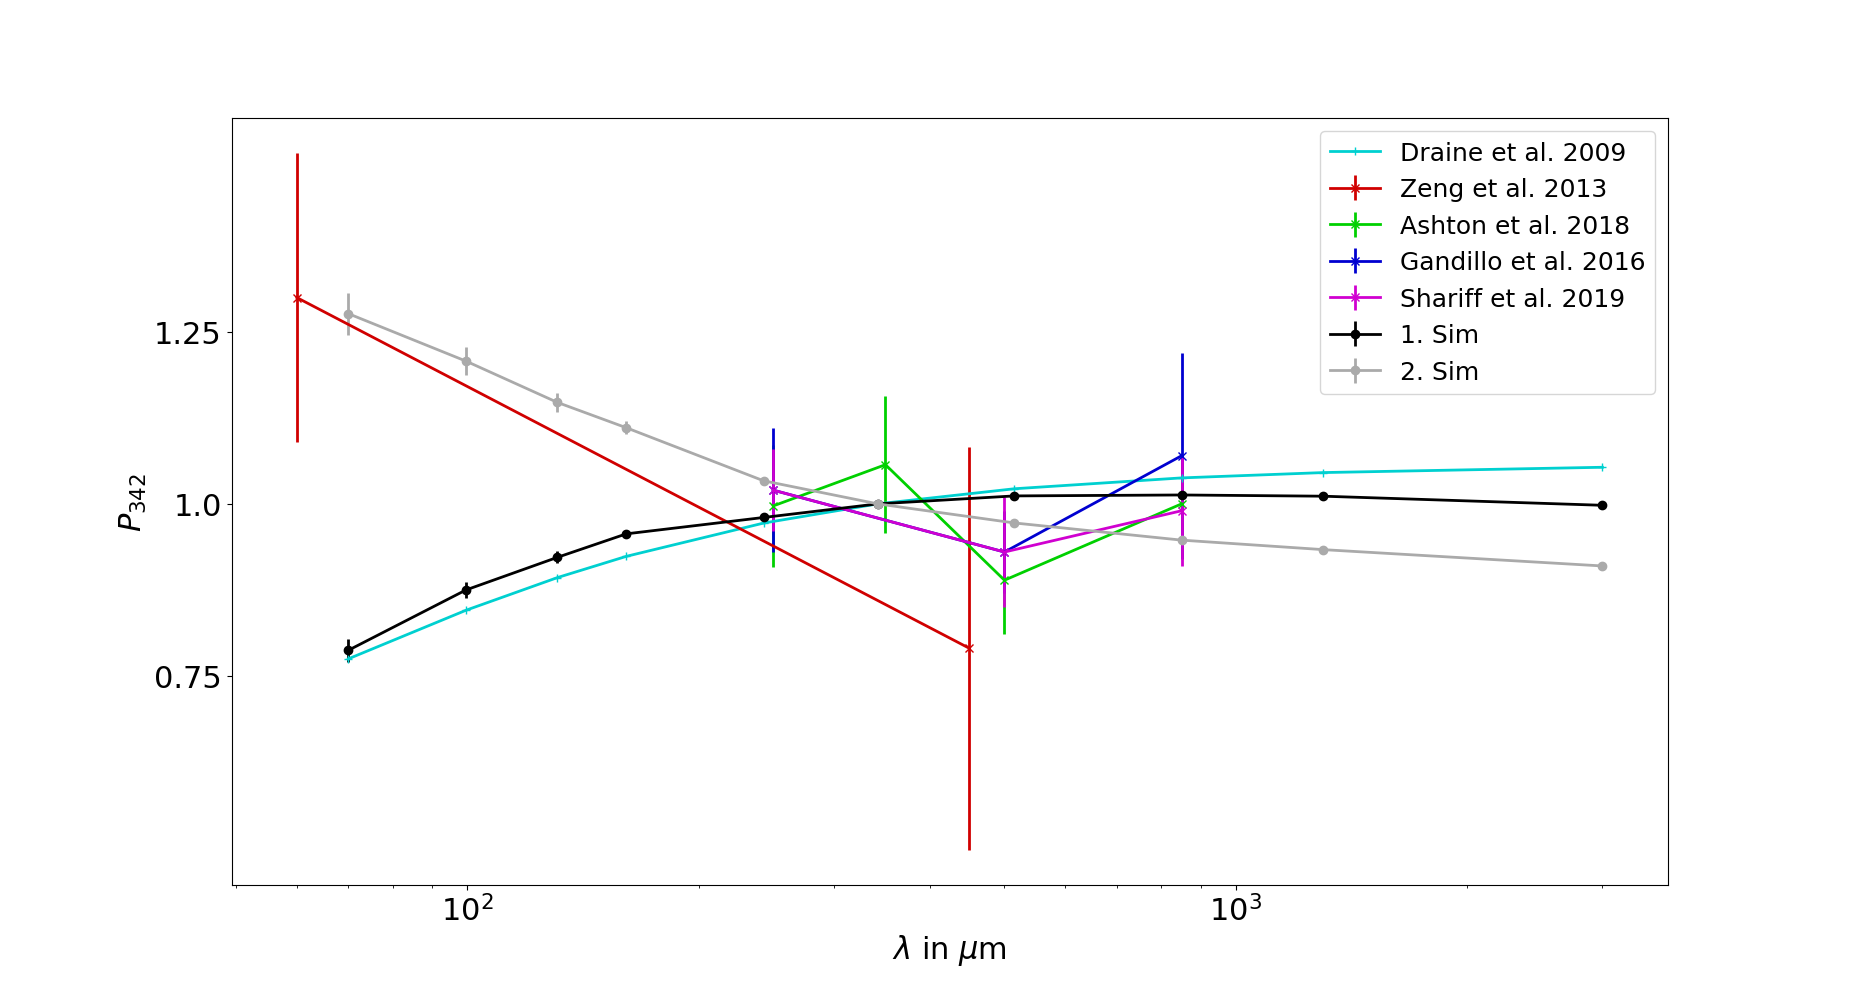
The results of this technique can be seen in Figure 1 and gives a rough estimate of the magnetic field structure. Usually, observations at different wavelengths are used to investigate the polarization of dust grains. To model this, we create synthetic polarization spectra from our simulations. We then compare this to observations and previous theoretical predictions in order to validate our results. This has been done in Figure 2. As described in a previous highlight, we tested a setup without stellar feedback and one with, described as the 1. Sim and the 2. Sim, respectively.
We compared our results against four recent observations and a theoretical model setup by Draine et al. 2009. We show that while the result without feedback shows very good agreement with the theoretical prediction, the result with feedback shows a better agreement with the observations. This is explained by having different sets of dust species within a line of sight, by for example having a mix of warm and cold dust grains. This effect is artificially created in our feedback simulations. We conclude that in order to see a falling polarization spectrum in the far infrared, such a difference in temperature is mandatory.

