Exploring the Chemical Evolution of Molecular Clouds
Marco Panessa
Modern astrophysical simulations have made enormous strides in accurately modeling the dynamical evolution of the interstellar medium. However, these simulations rarely model the local chemistry, apart from hydrogen- and carbon-bearing species which influence the gas temperature, since the computational cost is prohibitive.
We have developed a post-processing method which takes for its initial conditions the cloud's dynamical parameters and the limited simulation chemistry, and calculates the time-dependent abundances of numerous species in a much more extensive chemical network. By applying a robust network of 37 species and about 300 reactions (Seifried & Walch 2016) to the KROME chemical rate equation solver (Grassi et al. 2014), we expand the chemistry of a molecular cloud far beyond what is achieved during the simulation itself.
Our post-processing methodology is currently in active development, and has been tested upon the SILCC-Zoom simulations of Seifried et al. 2017. These simulations track the evolution of individual molecular clouds over several megayears, at a maximal resolution of 0.06 pc.
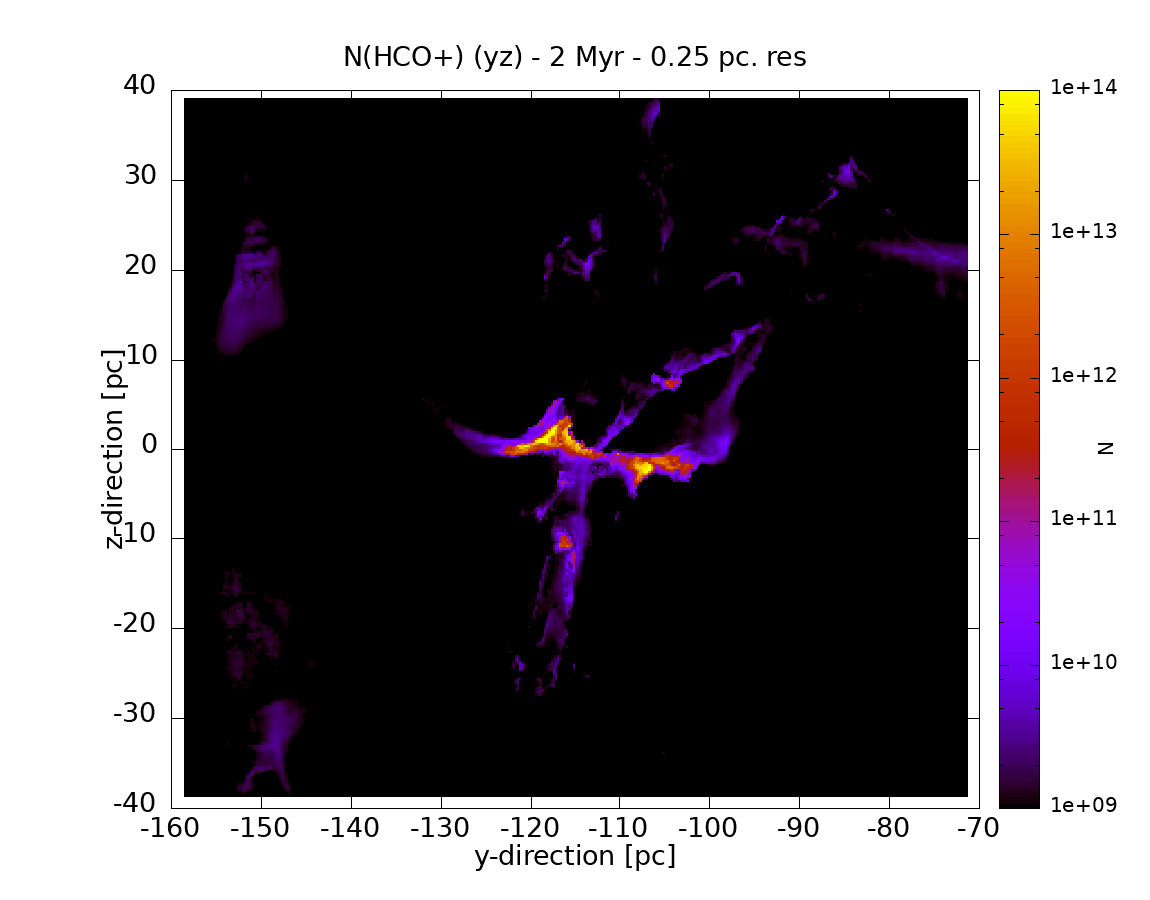
In Fig. 1, we show a post-processed column density projection of HCO+, a species present in our extended network but not in the original simulation. By comparing this to projections of H2 and CO, we find that HCO+ accurately traces the densest molecular gas.
The SILCC-Zoom simulations include about one million passive tracer particles which flow with the local density field. Because these particles report the time-dependent local dynamical and chemical properties of the molecular cloud, our post-processing method lets us analyze the evolution of individual elements of the simulated gas.
Fig. 2 displays the evolution of 400 selected tracer particles with regard to their local total hydrogen density and HCO+ abundance, plotted upon a heatmap of this relation for all tracer particles at a simulation time of 4 megayears. The selected particles are those with the highest HCO+ abundance at this time. By plotting their evolution, we see that these tracer particles reported much lower HCO+ abundance at earlier times, and generally undergo an increase of five orders of magnitude in HCO+ abundance while remaining around a total hydrogen density of 1000-10000 cm-3. In further work, we are studying the distribution of these evolutionary tracks to measure the formation timescale of HCO+.
