How do supernova remnants cool? - Morphology, optical emission lines, and shocks
Katya Makarenko
Radiative cooling is the main process of energy loss during the late evolutionary stages of supernova remnants (SNRs). This loss can be observed in SNRs due to optical, UV fine structure and forbidden transitions. These transitions are dominated by low ionization stages of elements such as sulfur, oxygen and nitrogen.
We present a post-processing module for the magneto-hydrodynamical (MHD) simulation (Seifried et al. 2018) carried out with the finite-volume code FLASH 4.3 (Fryxell et al. 2000), which calculates the cooling radiation from shock-heated gas of SNRs using cooling tables from MAPPINGS V (Sutherland et al. 2018). Due to the complex structure of the ISM, the SNR evolution is asymmetric and the cooling time can vary for different parts of the SNR bubble. As a result, optical emission lines are influenced by the geometry of the projection of the SNR onto the plane for the observer.
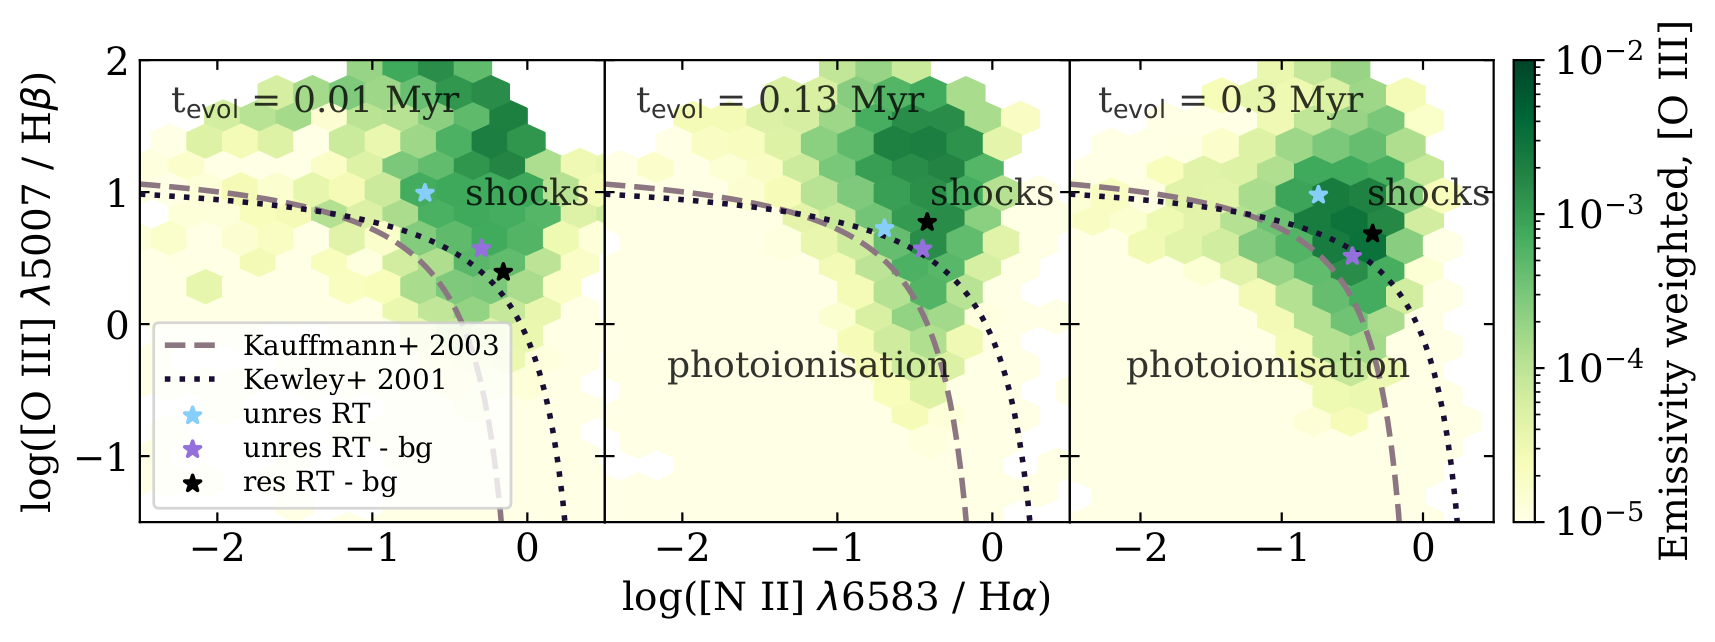
To investigate the distribution of the shocked gas, we use the “Baldwin, Phillips & Terlevich” (BPT) diagram. For SNRs in outer galaxies (unresolved), the BPT diagram is a powerful tool for identifying the radiative stage of SNRs, but the subtraction of background radiation is needed to correctly classify a SNR. In Figure 1 the position of unresolved SNRs without the background on the BPT can move almost to the “mixed region” (violet star).
Due to the volume-filling origin of [O III] and Hα emission, we have a lot of it in the background.
In case there are further ionizing sources in unresolved maps which are boosting the hydrogen lines, the mean values of the optical line ratios would further move towards the HII region part of the BPT. Hence, SNRs could be missed entirely.
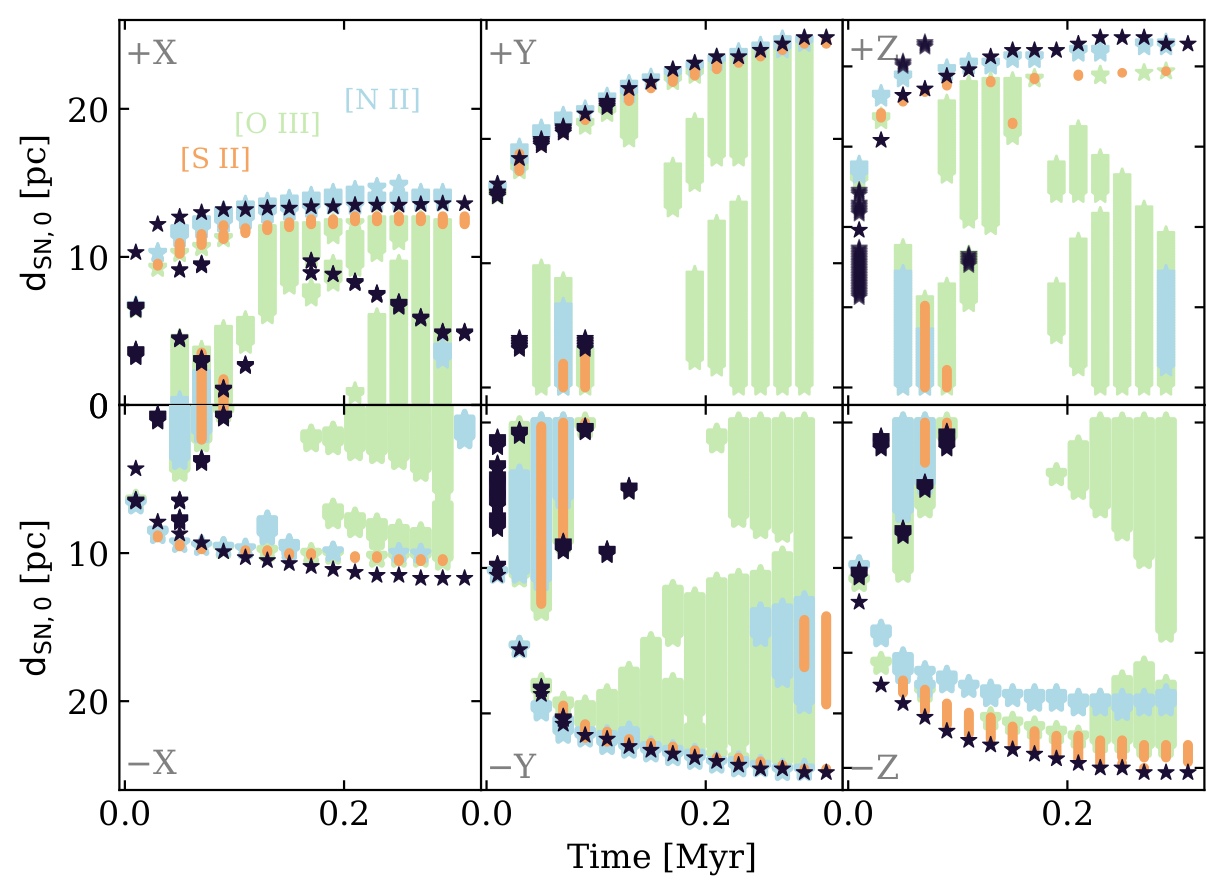
Shock waves are essential components of young SNRs: for most, the shell structure is defined by the forward and the reverse shocks. We use our shock-detection scheme to show that [S II] and [N II] emission arises from the thin shell of the SNR bubble and [O III], Hα and Hβ originate from the volume filling gas inside the SNR, as you can see in Figure 2. We can additionally use [S II] as a good tracer for the shock position.
Most of the observable life of SNRs is spent in the later radiative phases. Our tool is a step towards a better comparison of simulations and observations.
See Makarenko et al., 2023 for more details.