A subgrid model for the turbulent circumgalactic medium: Understanding the [CII] line emission
Lennart Buhlmann
The circumgalactic medium (CGM) is known to be all the gas, which is gravitationally bound to a galaxy, but outside its disk or interstellar material. Gas from the CGM fuels star-formation inside the galaxy. Furthermore, the CGM is the venue for material from galactic outflows. There, the gas is reprocessed and again provided for accretion onto the galaxy. Hence, this component of the galaxy is assumed to be a key regulator for galactic gas supply. Because of these aspects, the CGM is considered to have an important role in galaxy evolution.
In observations of galaxies at high redshift strong emissions of C+ (hereafter [CII]) are detected. They emerge due to the fine structure transition from the 2P3/2 state to the 2P1/2 state, which can occur spontaneously or is induced via collisions of C+ with, for example, free electrons e−, atomic hydrogen H or molecular hydrogen H2. An advantage of [CII] is that it can be utilized to trace the cool gas, as well as the warm-hot and low ionized gas.
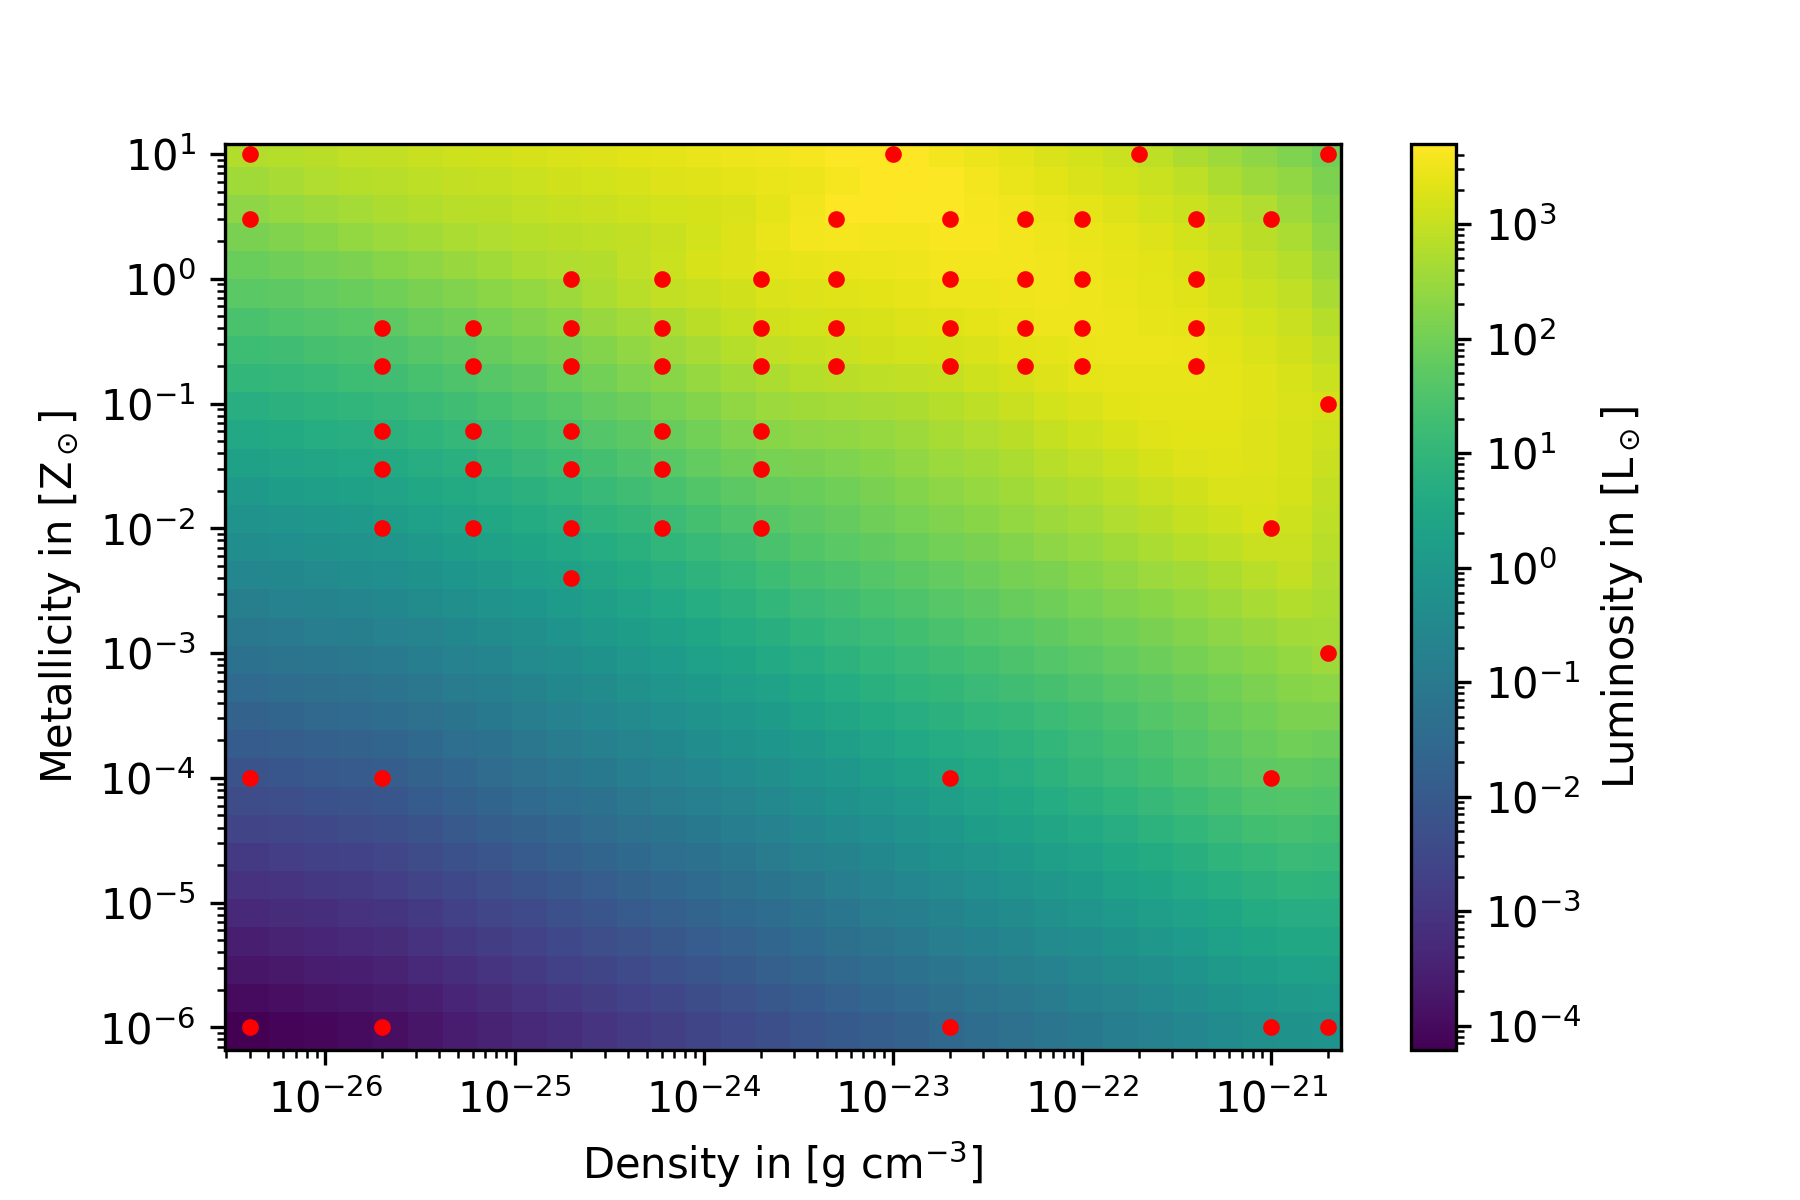
As [CII] is directly emitted from the CGM, it can be used as a tool for a better understanding of the role of the CGM in galaxy evolution. Therefore, we create a subgrid model for the TNG50 simulation (Nelson et al., 2019a). We perform 67 small-scale turbulent box simulations in FLASH using a chemical network tracing H+, H, H2, C+, O, CO and e−. Each simulation has different initial metallicity and density conditions. For every turbulent box we determine its [CII] luminosity. Fig. 1 shows the calculated luminosities for metallicities between 1e−6 and 1e1 Z⊙ and densities from 4e−27 to 2e−21 g cm−3. The colorbar provides information about the luminosity at each metallicity and density. Red dots indicate the initial conditions of our simulations. To generate luminosities for the whole parameter space we performed a linear interpolation.
In general, [CII] rises with increasing metallicity and density. This is due to higher number densities of C+ and its collision partners, which lead to a larger number of collisions. Hence, the increased luminosity. For metallicities Z ≳ 0.1 Z⊙ and densities ρ ≳ 1e−23 g cm−3 the luminosity due to [CII] decreases. Gas with these densities and metallicities cools down well enough, so that molecular gas is produced. In our simulations H2 and CO form, causing a lower amount of H and C+, and therefore less [CII] emissions.
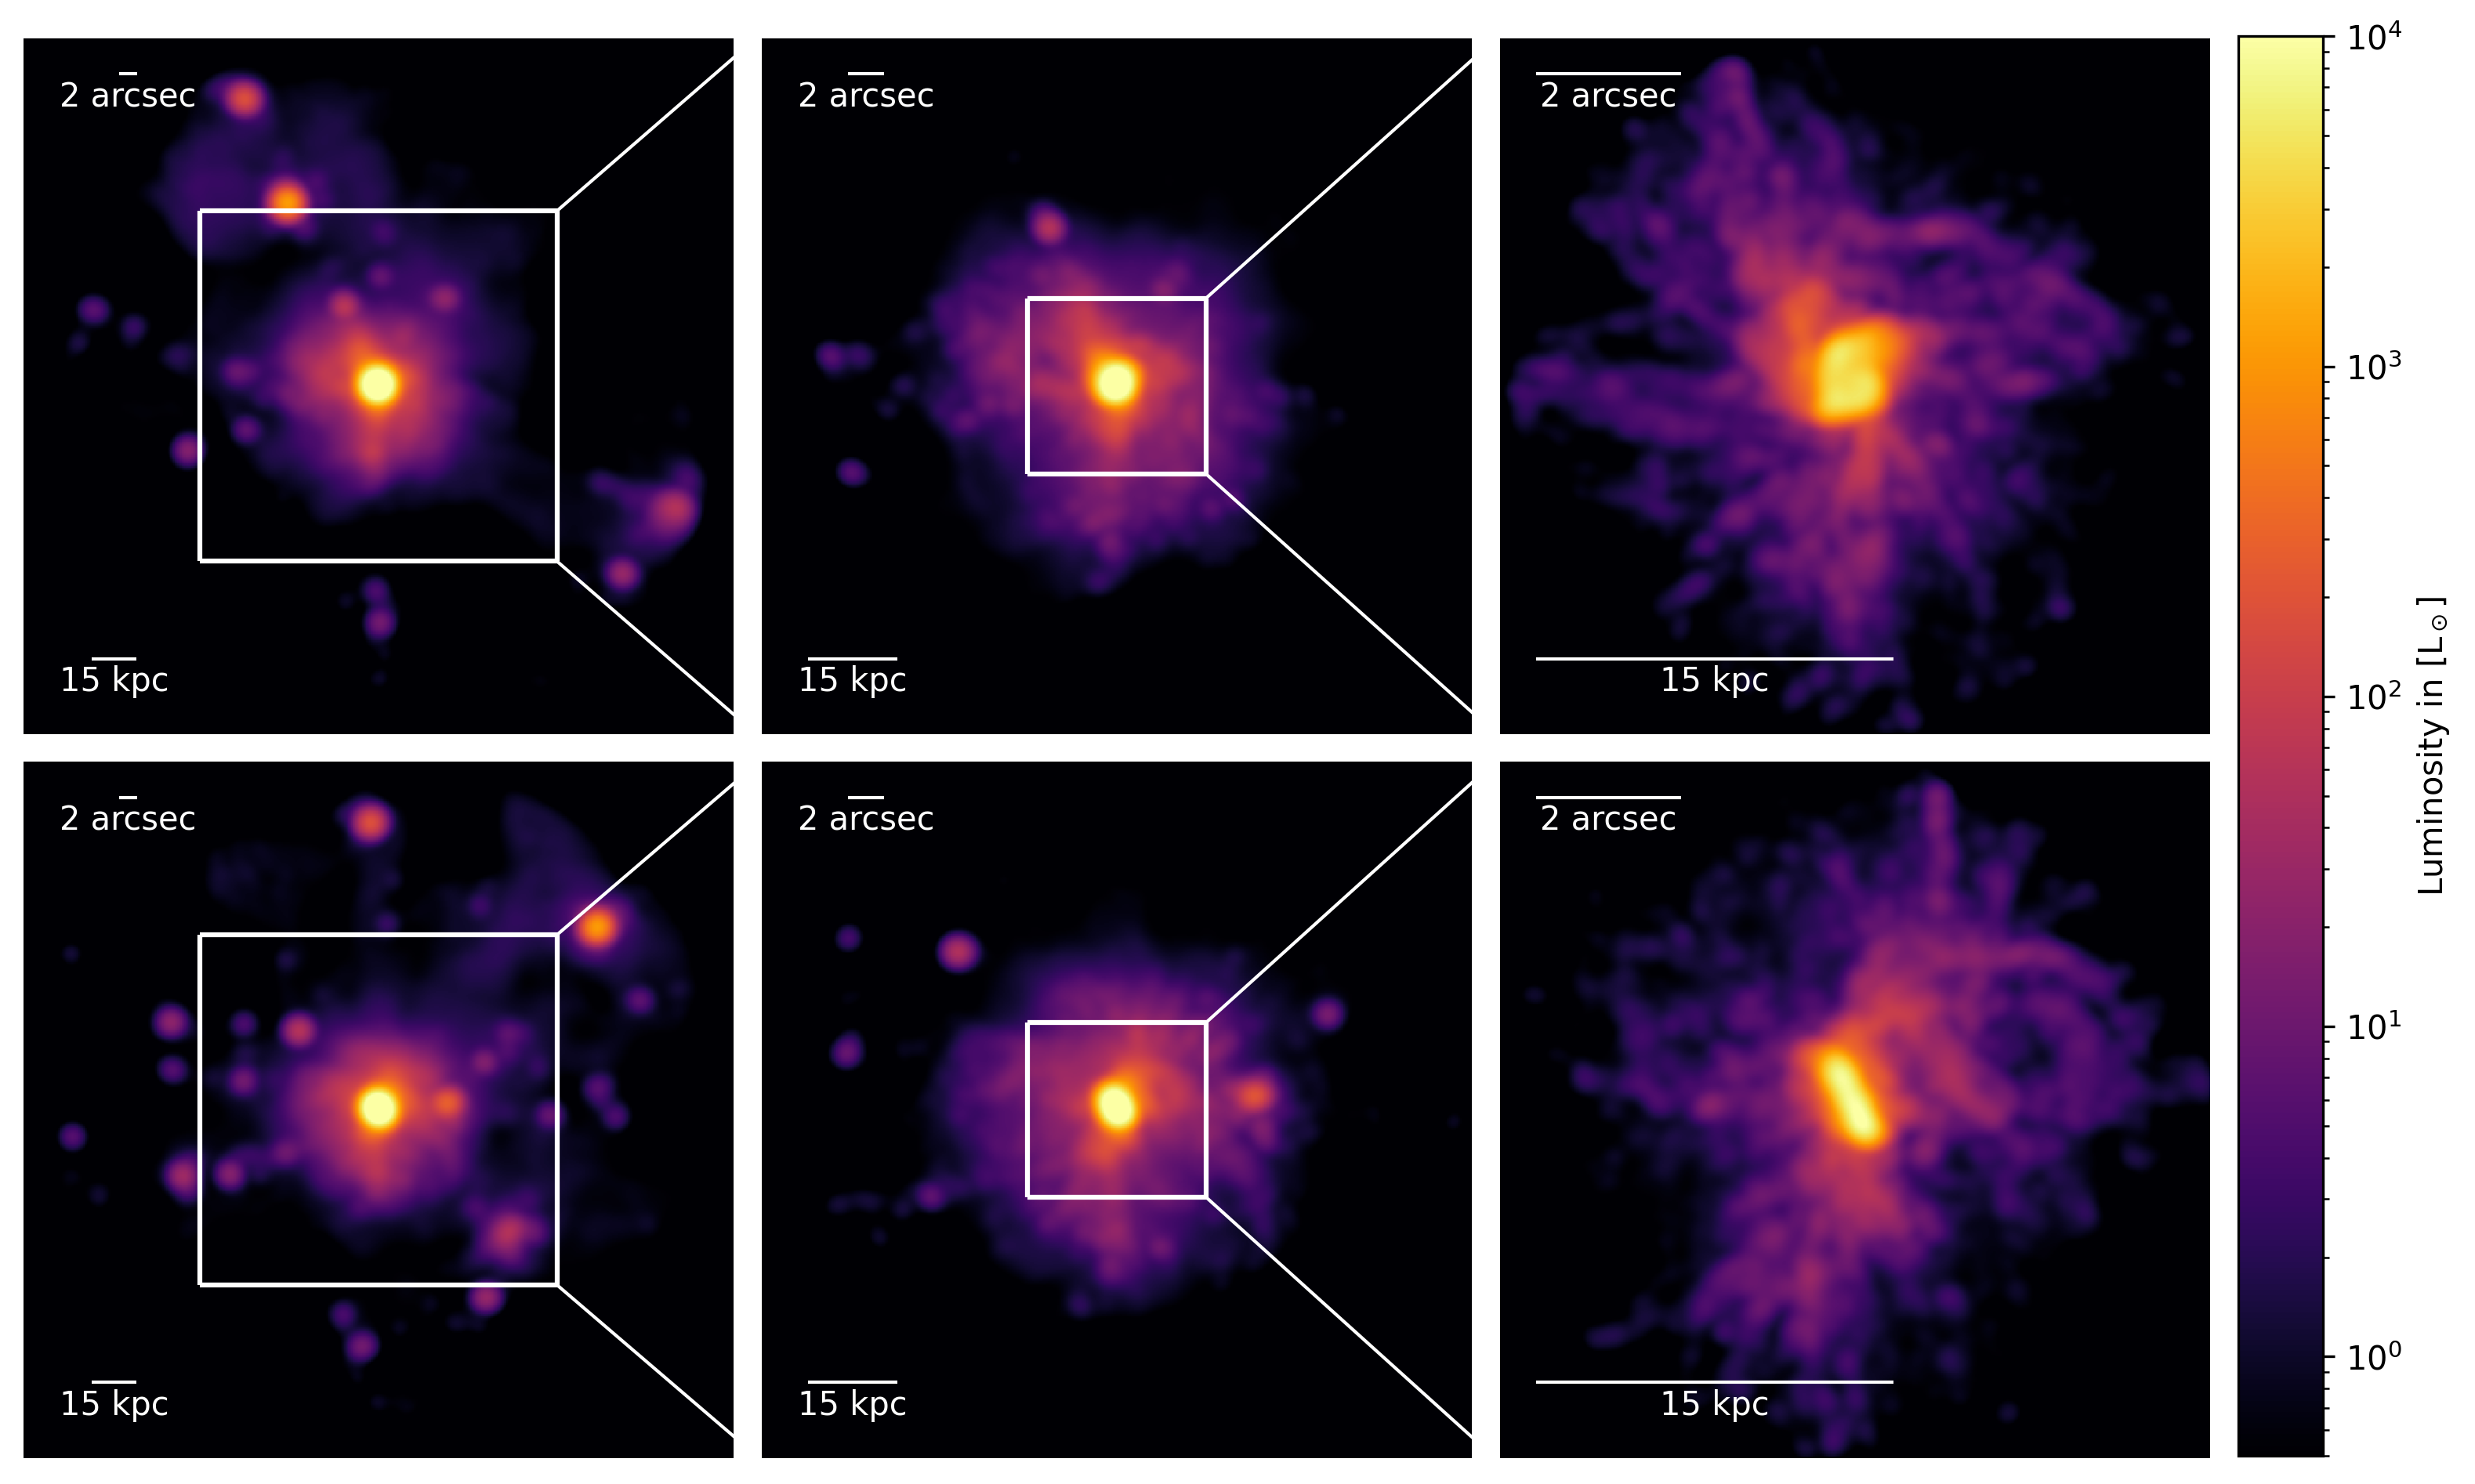
Using the subgrid model, the TNG50 halo can be populated with [CII]. With that, the analysis of [CII] in the TNG50 halo is enabled. Possible applications include calculating surface brightness profiles of the halo and to generate emission maps of [CII]. In Fig. 2 the emission map of the analysed TNG50 halo from face-on (top row) and edge-on bottom row can be seen. By increasing the resolution and zooming onto the galaxy (from left to right), this difference becomes visible. The left column in Fig. 2 reveals the occurrence of regions with higher [CII] emissions at large radial distances from the galactic center.