Statistical analysis of simulated supernovae in the optical energy band
Polina Smirnova
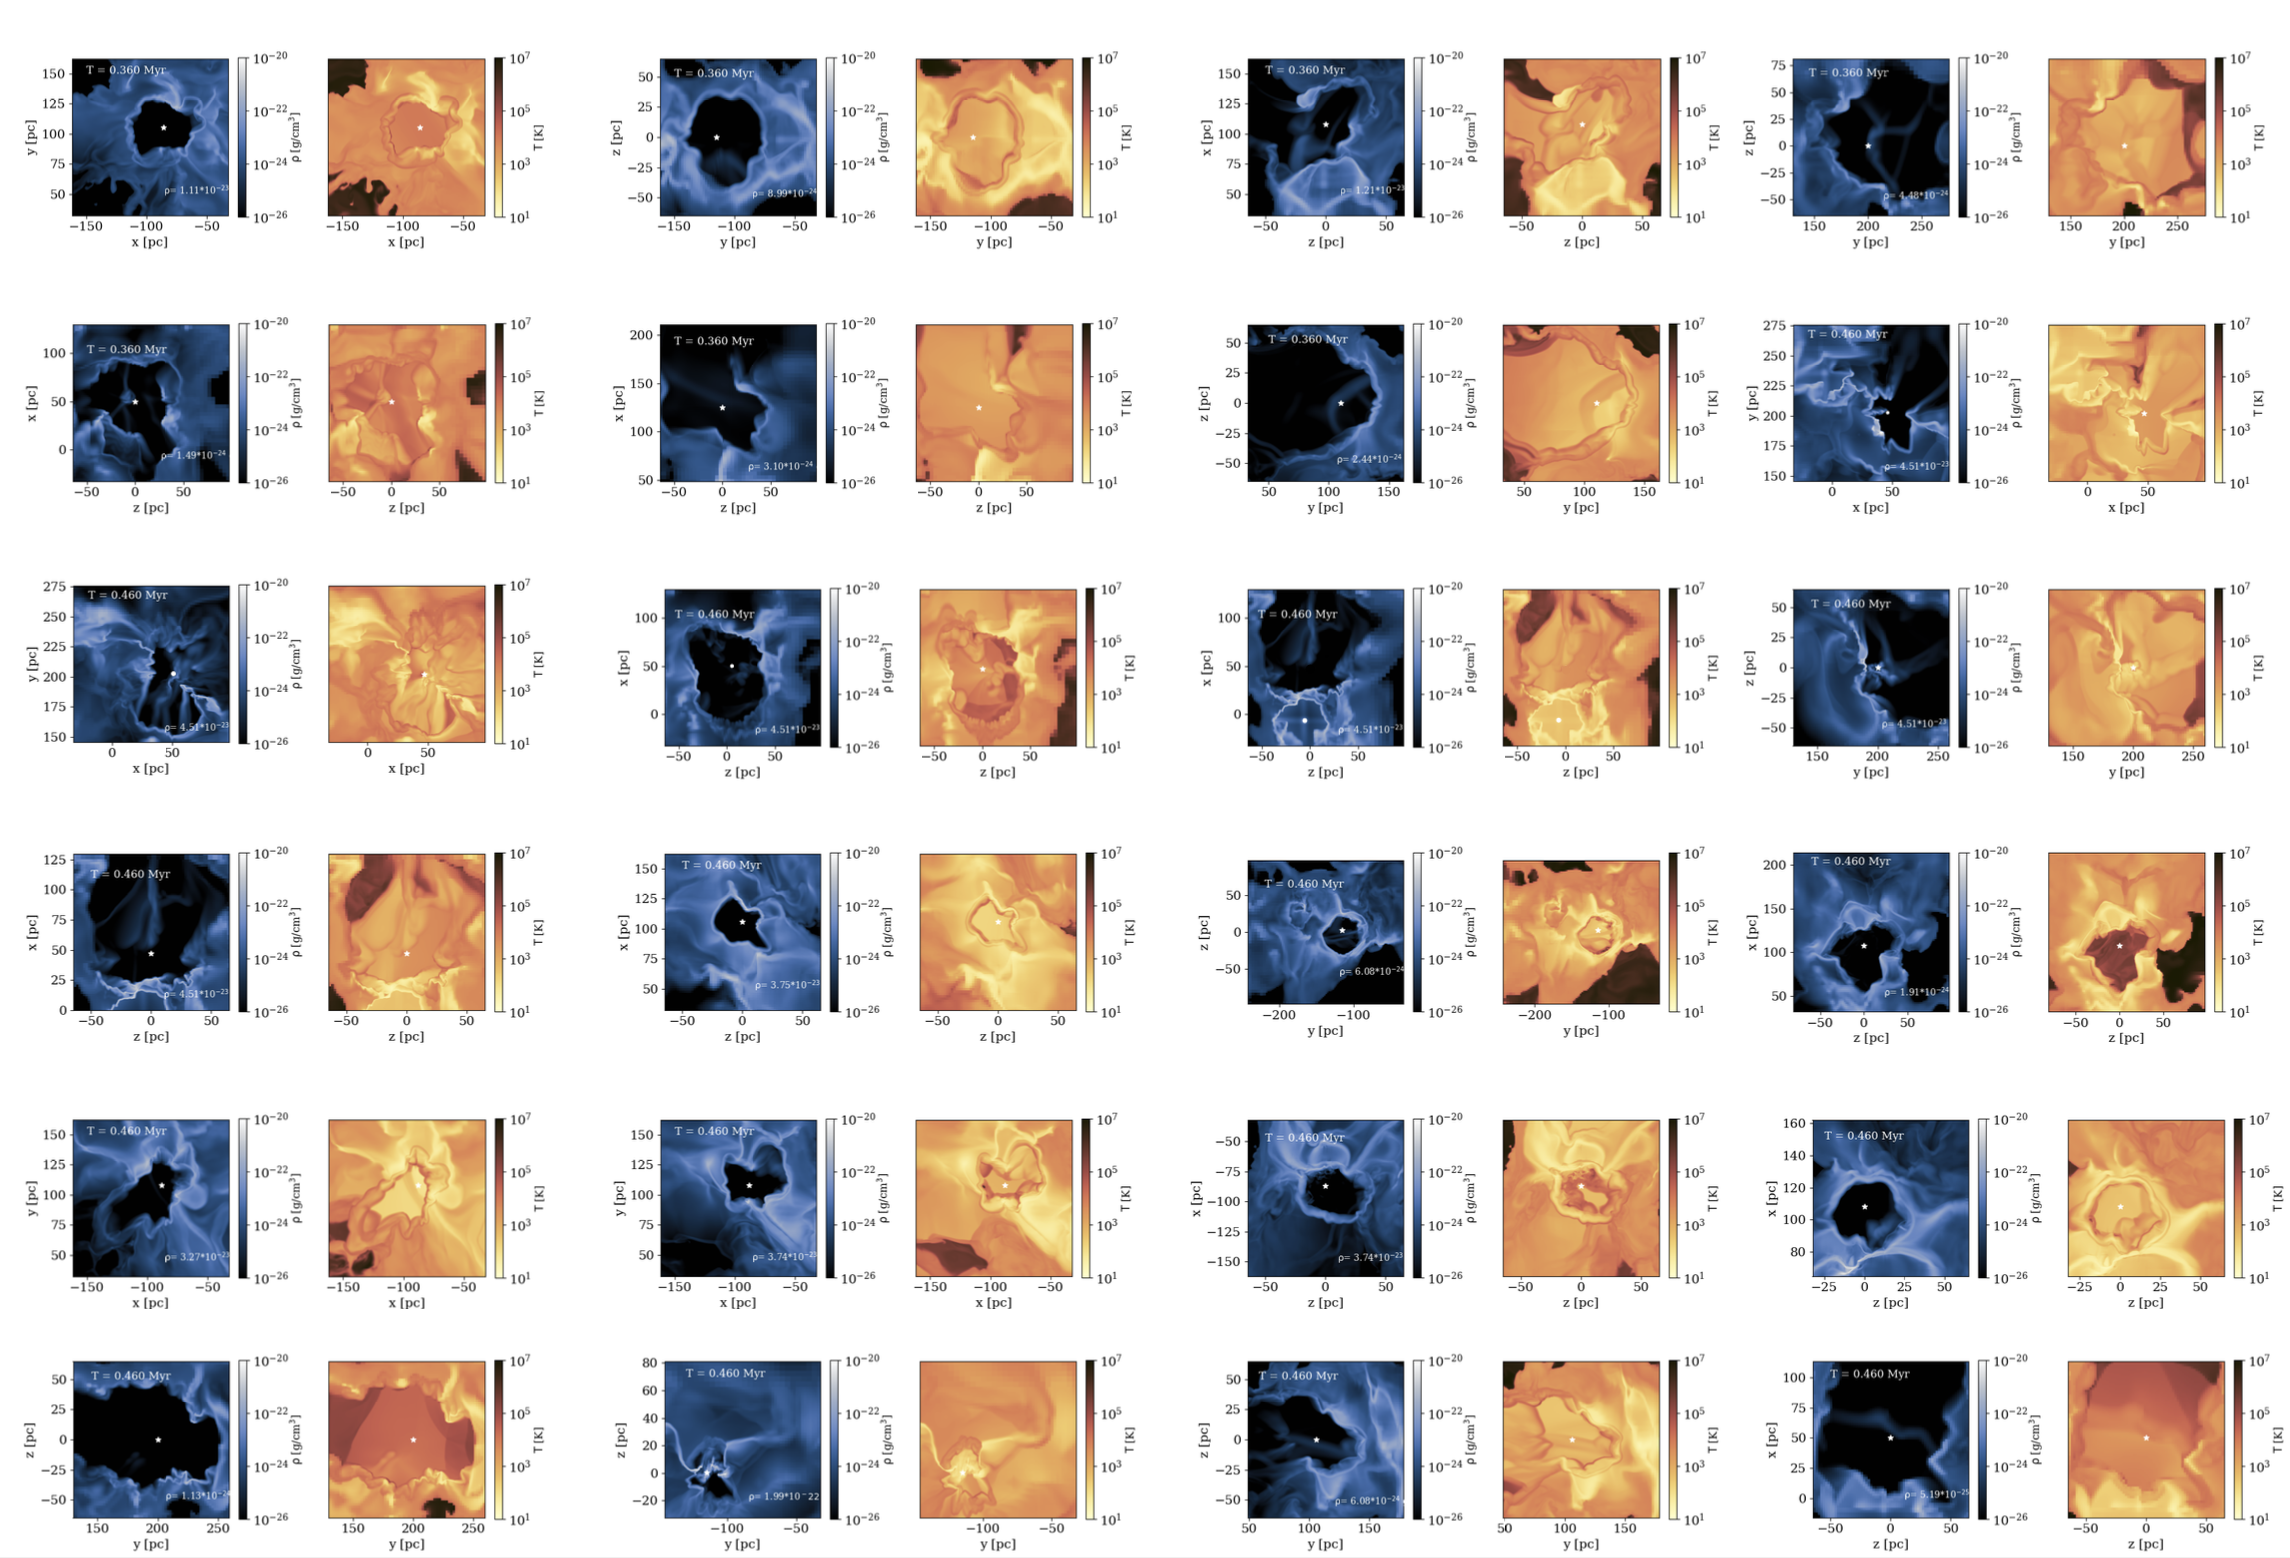
Massive stars (> 8 M⊙) end their life as a supernova (SN) explosion and about 1051 erg is released into the interstellar medium (ISM). In the later stages of SN evolution, about 70% of this energy is lost due to radiative cooling. This loss can be observed in forbidden lines in the optical range, e.g. [O III] (λ 5007), [N II] (λ 6583), [S II] (λ 6717, 6731), Hα (λ 6563), Hβ (λ 4861). In this work, we have carried out a statistical study of the optical emission of SN remnants which are simulated using the 3D (magneto)hydrodynamic code FLASH in a realistic ISM. Two positions of the SN were considered: at distances of 25 and 50 pc from the centre of mass of the molecular cloud. Then optical emission is reproduced using our optical emisssion post-proccessing tool based on cooling tables from MAPPINGS V code. We studied the influence of magnetic field (MHD vs HD) and the position of the SN (25 or 50 pc from the molecular cloud) on the optical emission.
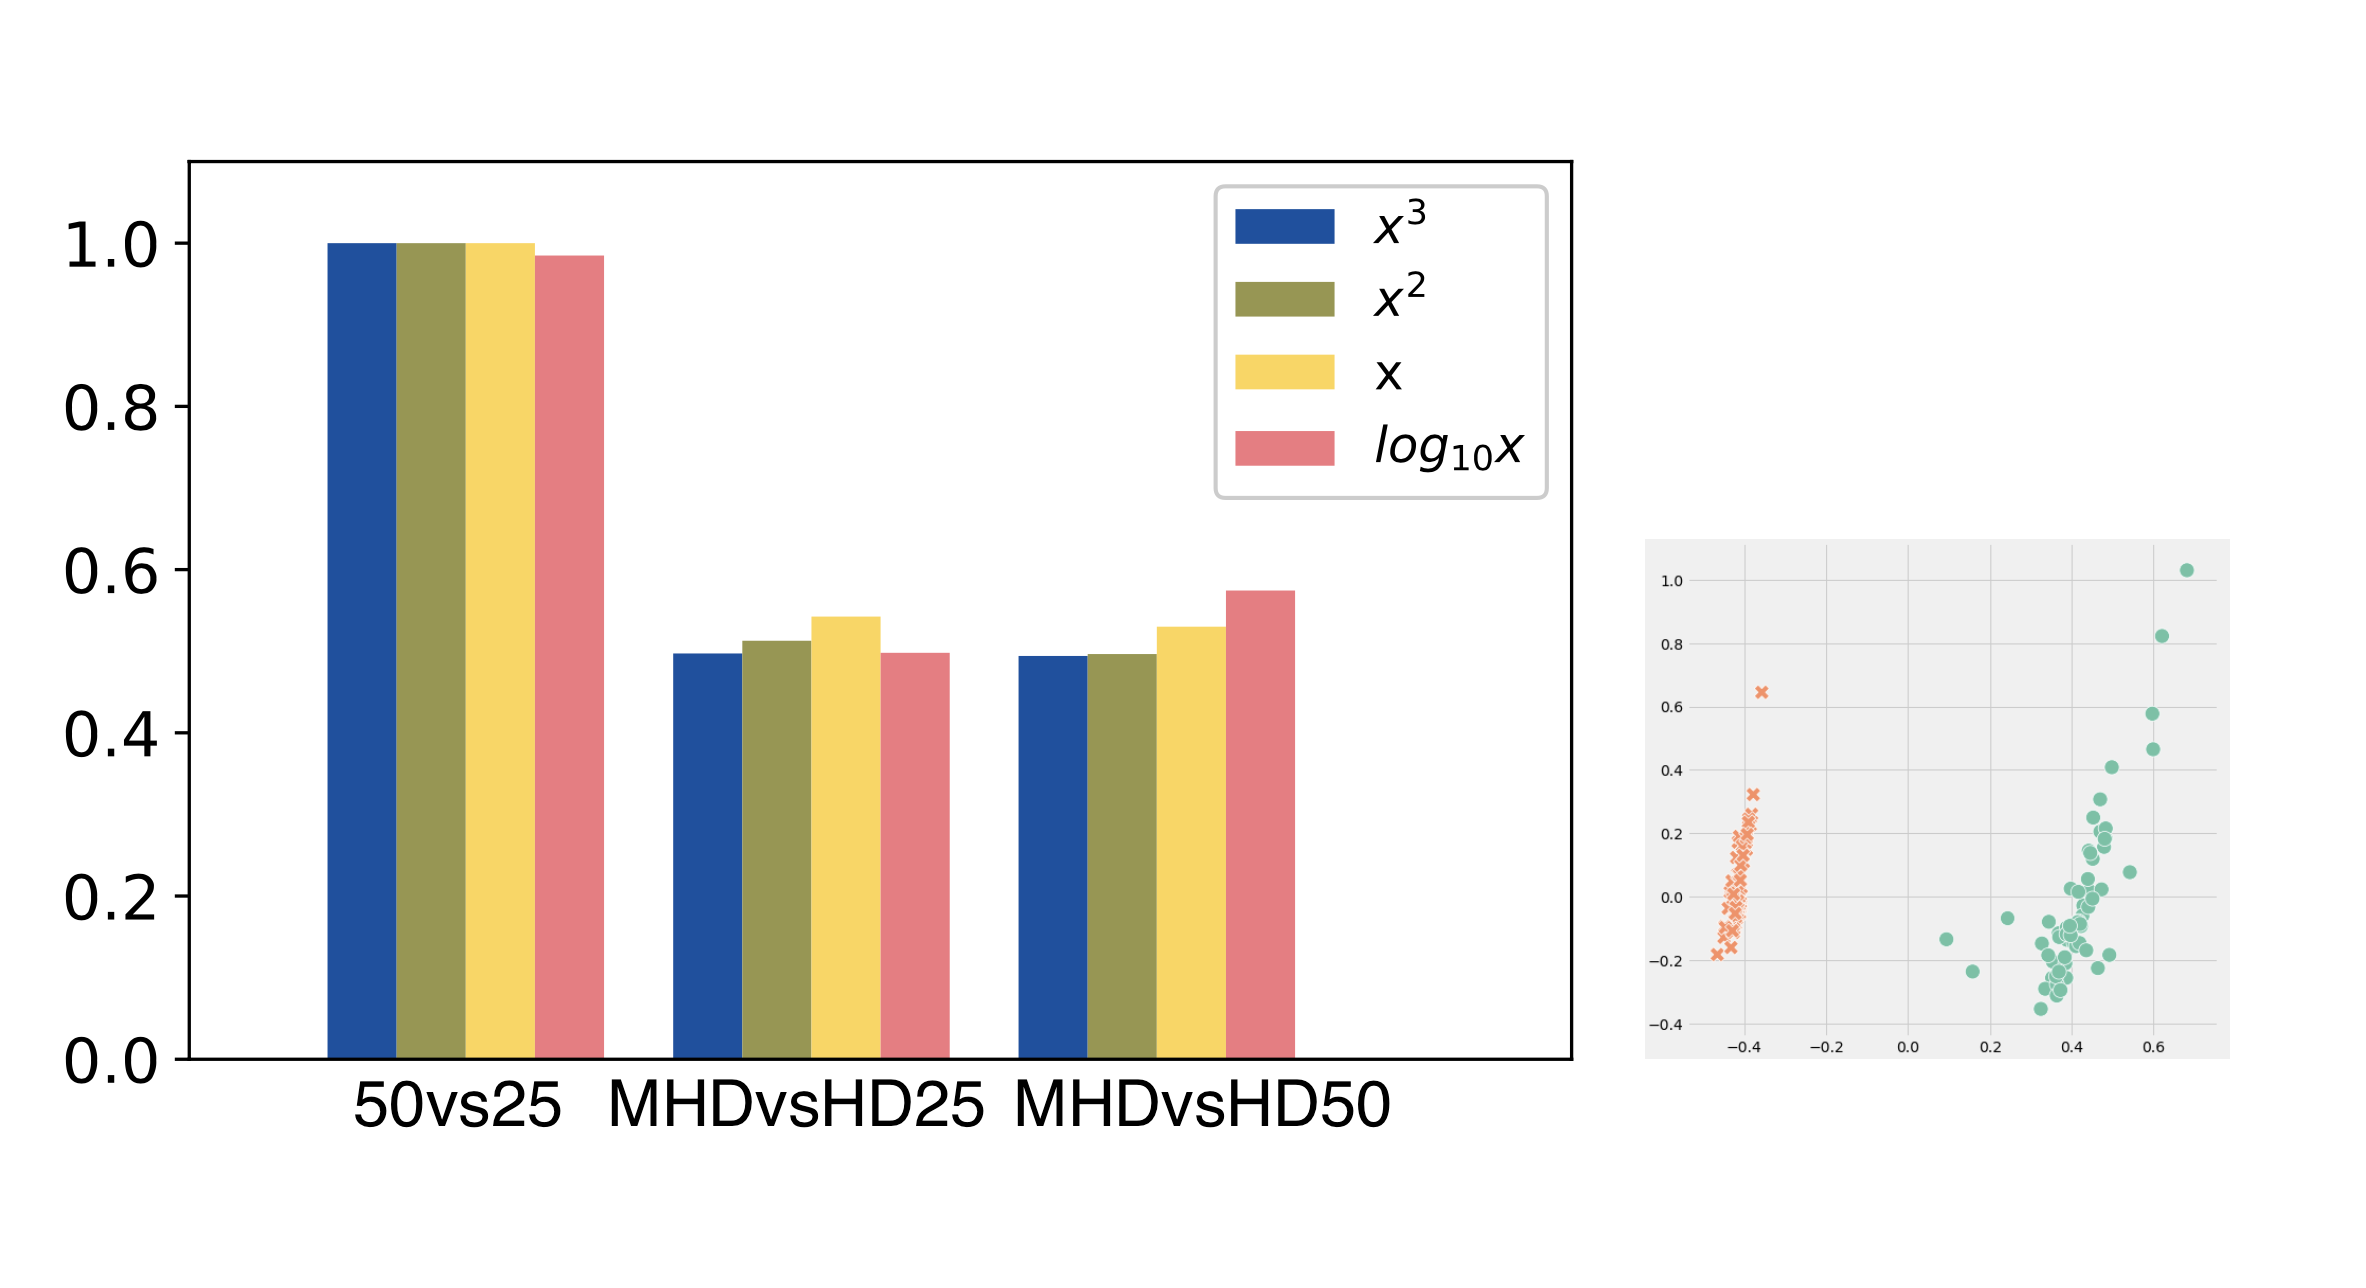
We started from a four-dimensional dataset of line ratios ([O III] (λ 5007)/Hβ, [O III] (λ 5007)/Hα, [N II] (λ 6583)/Hα, [S II] (λ 6531)/Hα) for four different cases of initial parameters (MHD 25 pc, MHD 50 pc, HD 25 pc, HD 50 pc). First of all, the number of dimensions had to be reduced (from four-dimensional dataset to two-dimensional), to use only independent line ratios. The reduction was done by the principal component analysis (PCA) and t-SNE algorithms. PCA chooses the main components with the biggest dispersion, and t-SNE calculates the measure of similarity in the high and low dimension spaces and minimises the Kullback-Liebler divergence. Then the data is divided into clusters with the k-means algorithm. k-means minimises the sum of squares (using Euclidean metrics), between the centres (which were already found) and points in the scatter-plot. At the end we use the Rand index that indicates the similarity between the assumed (original, e. g. with and without magnetic field or 50 vs 25 pc) clusters and the predicted clusters from the algorithm. The closer the Rand index is to 1.0, the better the clustering is. Various transformations of the initial data were also considered: polynomial, standard and logarithmic. The best Rand index is obtained for data without change.
As a result, the presence or absence of a magnetic field has almost no effect on the optical emission from the SN remnant and the difference can not be found statistically. However, the density distribution at the site of the SN changes the entire evolution of the SN remnant. The interaction of the SN remnant with the inhomogeneous structure of the molecular cloud significantly affects the distribution of hot gas. This changes the observational characteristics of the SN remnant and makes it possible to distinguish between SN exploded at 25 pc and 50 pc from the center of mass of the molecular cloud. These datasets are easily divided into different clusters.

